Your Underperforming Digital Marketing Agency


3 Marketing Metrics You Have To Know Before Analyzing Results Of Any Digital Marketing Campaign
Filed under:
Uncategorized
Comments:
Comments Off on 3 Marketing Metrics You Have To Know Before Analyzing Results Of Any Digital Marketing Campaign
If you are a digital marketing manager or a business owner trying to run digital marketing campaigns yourself – you know how frustrating it is sometimes to understand results and see a full picture (as what channels precisely are attributed to a conversion).
If you look at Google Ads or Facebook ads data – sometimes you would see lots of conversions attributed to those campaigns, but often they wouldn’t match with what Google Analytics tells you or even with your own sales CRM.
Most small companies give up on some valuable channels, like Google or Facebook ads when they don’t see significant results after one month – or if they observe significant discrepancies between their Google Analytics and the advertising channels itself.
There are many nuances in the digital marketing analytics world; these nuances are often confusing even to the most experienced digital marketer. In this article, I will show you:
- What information you have to know before starting your campaign or digging deeper into Google Analytics
- Major reasons for discrepancies and how to see a better result picture of your digital marketing campaigns
Marketing Metrics You Should Determine Before Any Major Marketing Campaign Online
-
Your Customers/Clients Purchase Decision Cycle
Your customer decision cycle can impact how you see campaign performance and how you run retargeting campaigns online. Is it 2-3 days or 2-3 months? Do your customers make a decision right away, or does it take them a few days/weeks/months researching your competitors and alternative solutions before they decide to go (or not to go) with your product or service?
I’ve seen clients run a few Google and/or Facebook campaigns for two weeks, saw no conversion, and paused it, thinking it wasn’t working for them. The truth is, it takes 2 to 4 weeks for an average customer in their industry to make a purchase decision! So, after pausing the campaigns they would get some conversions/leads a few weeks after – think they magically appeared out of direct traffic or organic search. Below are a few ways to discover your customers’ purchase decision cycle:
-
Google Analytics Time Lag Report
Google time lag report shows how many days passed before a customer’s first visit and their final conversion. You can go as far as 90 days in the past – which should be enough for many B2C and even some B2B business.
Let’s take a look at the two examples.
Example 1: Over 34% of conversions are coming after 60 days
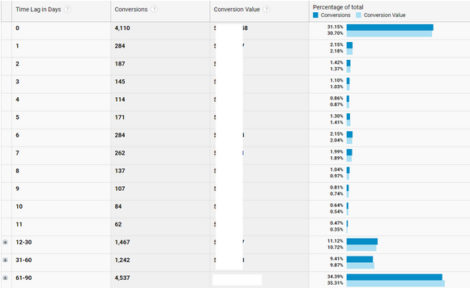
This is an example of a time lag report from one of our clients. Although 31% of the conversion came within the user’s first visit, over 50% of conversions happened between 12-90 days after the first visit, with 34% of conversions happening after 60 days!
Initially, they thought their Google Ads weren’t working well since they set their Google Ads conversion window to 30 days. Increasing the conversion window and analyzing results beyond the 30-day window showed us that most of the campaigns brought lots of conversions with a great ROAS (Return On Ads Spend).
Example 2: Most of the conversions are instant
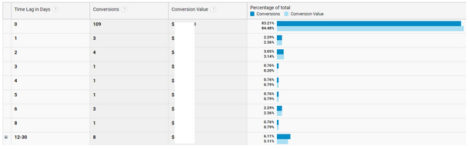
For this client, most of the conversions (83%) happened within prospects’ first visit! It’s great, but they have wasted much money on unnecessary retargeting campaigns (making ads for customers who already visited your site but didn’t convert).
Knowing that over 80% of customers make up their minds after their first visit, we restructured retargeting campaigns, saved the client some advertising budget, and got even more conversions for those 15% of users who needed some more time to decide before the purchase.
-
You customers/clients lifetime value (LTV)
Do you have lots of repeat purchases? Do you think your customers may benefit from other complementary products or services in the near future? How long are they staying subscribed for your services, and what’s the chance they will extend their contract for another term (three months, six months, a year)?
Knowing this information can help to determine the right strategy for your digital marketing campaigns. For example, if your customer’s LTV is $3,000 based on an average of 3 purchases within one year, we can technically afford to spend up to $200-$500 on acquiring a new lead (depending on your margins). This will allow us to bid higher on more competitive terms, for example, and we will be able to dominate the top positions in Google Search.
On the other hand, if it’s only one purchase and most of your customers never return, and that one purchase averages in $1,000, then we can afford to spend only, let’s say, $50-$200 on acquiring a new customer. The option here is to either go for less competitive terms, or bid lower, which would reduce our impression share, and therefore less prospective customers who would be interested in our products or services otherwise will see our ads.
-
How often do your customers make repeat orders?
Lifetime value can be a tricky thing to estimate correctly, but we can determine how often your customers make repeat orders, helping us understand each customer’s “short-term” value.
If we know how many days your customers make a repeat purchase, it can help us with proper tracking and estimating how much we can spend on acquiring a new lead, but it also will help us increase those repeat purchases through retention remarketing campaigns.
Let’s say you have a regular repeat purchase rate, like a grocery delivery business. You probably know your customers’ repeat rate based on your own CRM, but you also can find this information in Google Analytics (or to confirm if there are any discrepancies) by going to Cohort Analytics and selecting Transactions by Day.
Let’s take a look at a cohort analytics report of one of our customers with a high repeat order rate.
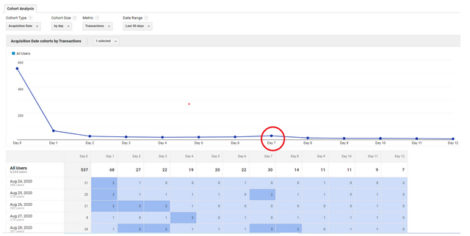
From this report, we can see that most customers make a repeat purchase on day 7 (a week), which makes sense for a grocery delivery business.
Knowing this information can help us with many tasks, like:
- Expanding a conversion window in Google Ads to 90 days (maximum)
- Let’s say we spend $60 on acquiring a new customer for non-branded terms (prospecting), and an average order is $80
- If we leave a default 30-days conversion widow tracking – our ROAS will show as 5.3 ($320 – 4 repeat orders within one month/$60)
- If we expand our conversion window to 90 days, our ROAS for acquiring a new customer is 16 (!). And it’s only for the first 3-months of repeat orders!
- Let’s say we spend $60 on acquiring a new customer for non-branded terms (prospecting), and an average order is $80
- Properly evaluating reports in Google Ads, Facebook ads, and other channels – knowing which periods to compare.
- In the case of an average 7-day repeat purchase cycle (as above), if we compare results Months-Over-Month in Google Ads or any other ad network for that matter – we will see a decline (unless your conversion tracking set-up to track only one conversion per user) since our purchase value keeps increasing every week.
- By setting-up a conversion window as 90 days we can genuinely compare how a campaign performs after those 90 days have passed (although in Google Analytics, we can see real-time results for a quick analysis, especially if you have been running campaigns for a while – the reason is Google Analytics counts conversions when they actually happened on your website, and Google Ads attributes a conversion to a day when your ad was clicked )
- Setting-up remarketing retention and remarketing acquisition campaigns properly
- Knowing that most of our customers make a repeat order every 7-days, we can set-up a retention remarketing campaign reminding them in between days 5-8 after their order to make a new purchase.
- Giving a promo to the customers who purchased once but then didn’t refill after 1-3 periods (in our case, it is 7-21 days)
- Giving some nice discounts or other incentives to customers who never purchased with us after visiting our site. In our case, they probably went to another grocery delivery service, so we shouldn’t remarket right away, but when it’s time for them to refill their groceries again (7-21 days).
The more you understand those three marketing metrics for your business, the more accurate you will track your digital marketing efforts and estimate the actual value and ROAS for each campaign.
Contact us and see how we can increase conversions for your business:
Author:

Sergey Izbash (founder of Duck Your Agency)
With over eight years of digital marketing experience, Sergey decided to create Duck Your Agency to bridge the gap between unhappy business owners (decision-makers) and digital marketing talent who wanted more flexibility and freedom to implement their ideas. Duck Your Agency is the first of its kind anti-marketing agency digital marketing agency. Since then, the results have been great – Duck Your Agency clients receive the full agency experience, with even more attention to their accounts, less human errors in their campaigns, at a more affordable price range.