 Your Underperforming Digital Marketing Agency



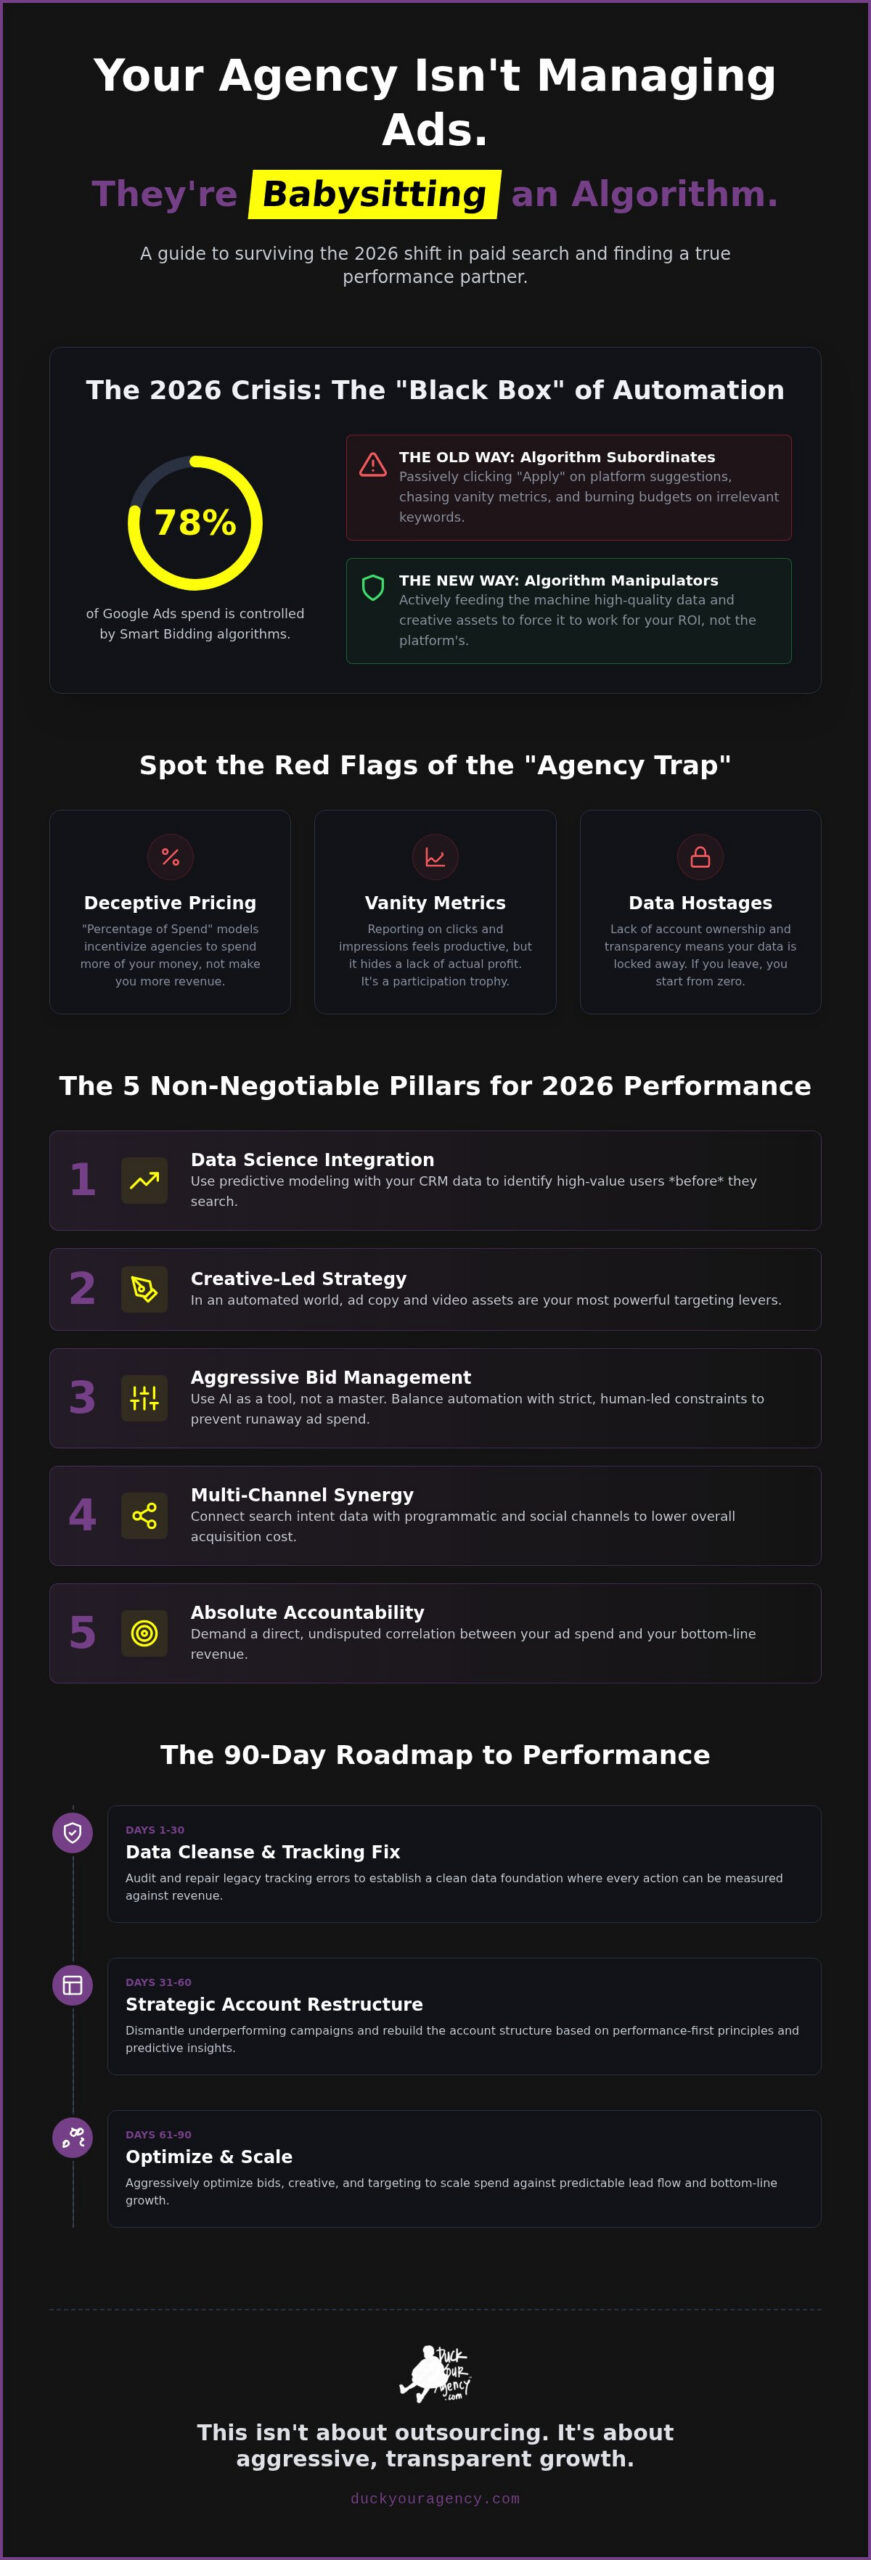
Your agency isn’t managing your ads. They’re babysitting an algorithm. In 2026, where Smart Bidding controls 78% of Google Ads spend, most providers have become passive observers of the Black Box. You’re likely watching your budget burn on broad, irrelevant keywords while your internal team battles burnout trying to decode fluff-filled reports. It’s frustrating to see vanity metrics climb while your actual revenue stays flat. You deserve better than an outsourced paid search management partner that hides behind automated noise and standard excuses.
It’s time to stop paying for participation trophies. This guide cuts through the industry bureaucracy to show you exactly how to select a performance-first ally. We’ll break down the shift toward AI-powered search, the impact of the SEC Marketing Rule on RIA advertising, and why the traditional agency model is failing under the weight of automation. Learn how to secure predictable lead flow and data-backed insights without the usual agency headache. This isn’t just about outsourcing. It’s about aggressive, transparent growth.
Key Takeaways
- Stop babysitting algorithms. Learn why traditional in-house efforts are failing against “Black Box” automation and how to pivot to a strategy that actually drives revenue.
- Identify the red flags of the “Agency Trap,” from deceptive “Percentage of Spend” models to the lack of account transparency that keeps your data hostage.
- Master the 5 non-negotiable pillars of outsourced paid search management, focusing on predictive data science and creative-led targeting over outdated manual bidding.
- Follow a rigorous 90-day roadmap designed to cleanse your data, fix legacy tracking errors, and restructure your account for 2026 performance levels.
- Shift your focus from vanity metrics to high-impact growth by integrating elite data science into your managed search execution.
The 2026 Crisis: Why In-House Paid Search Management is Failing
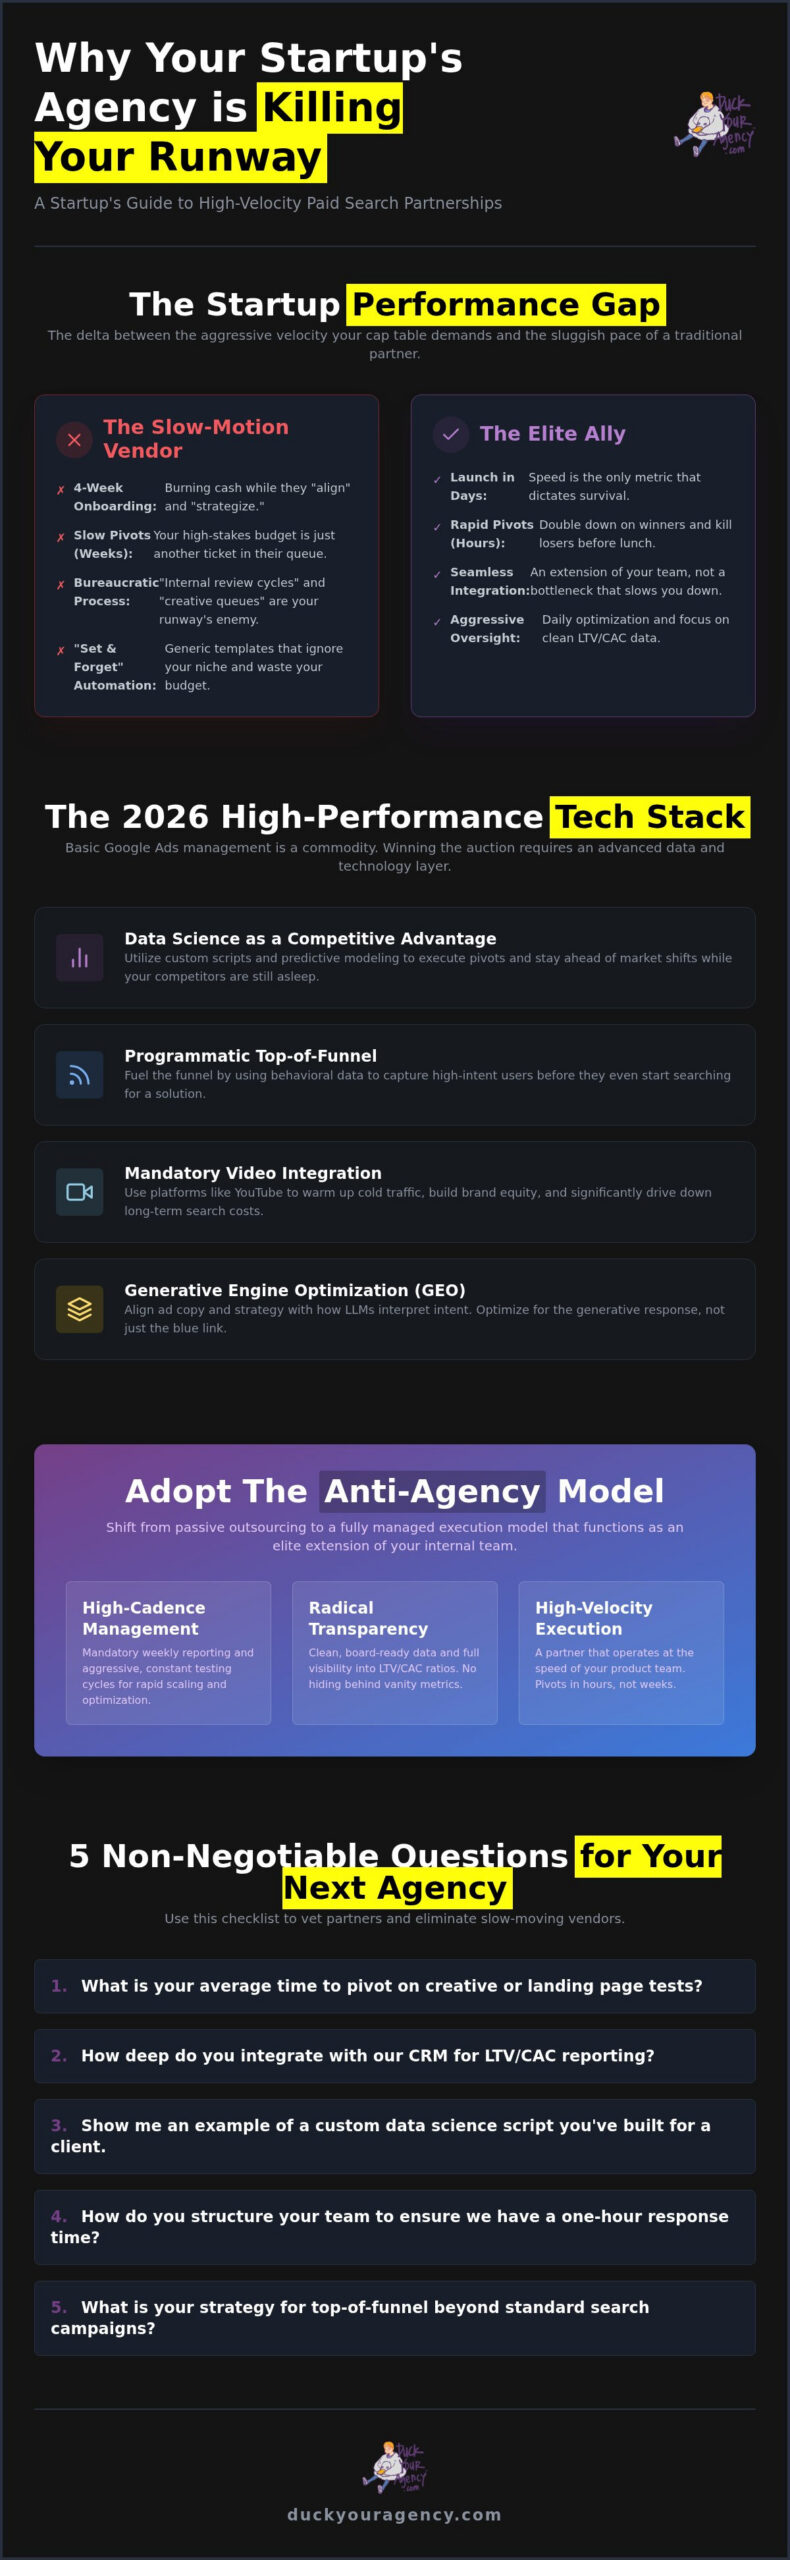
Hiring a single “PPC guy” is a relic of 2015. In 2026, you’re fighting a war of signals, and your in-house team is likely bringing a knife to a drone fight. Most internal departments are currently drowning in the “Black Box” of platform automation. True outsourced paid search management isn’t a desperate cost-saving tactic. It’s a strategic transfer of execution to elite specialists who know how to manipulate the machines rather than being managed by them.
We’ve entered the era of the Black Box. Google and Bing have moved toward total automation, leaving advertisers with less direct control than ever before. With Smart Bidding now managing 78% of all Google Ads spend, your in-house team isn’t “managing” anymore. They’re spectating. If they’re just clicking “Apply” on platform suggestions, they aren’t experts. They’re subordinates to an algorithm that doesn’t care about your profit margins.
The Complexity of Modern Ad Platforms
The landscape of Search Engine Marketing (SEM) has shifted. We’ve moved from simple keyword bidding to complex, intent-based audience signals. Platforms like Performance Max (P-Max) promise ease but deliver opacity. These systems require more human oversight, not less. You need specialists who can feed the algorithm high-quality first-party data and creative assets. If you’re blindly following “Google Recommendations,” you’re just funding their next quarterly earnings report. Those suggestions prioritize platform revenue over your ROI every single time. “Set and Forget” is a recipe for budget incineration.
The Real Cost of In-House Burnout
A single in-house manager is no longer enough for multi-channel success. According to industry data, a fully loaded PPC manager costs between $80,000 and $130,000 per year. That’s before you add the cost of a modern tool-stack and the inevitable price of their learning curve. When that person burns out and leaves, you’re hit with “Campaign Amnesia.” Your historical data, nuances, and hard-won strategy walk out the door.
An external partner provides a stable, aggressive perspective that an internal hire can’t match. We see data across dozens of high-performing accounts, spotting trends and platform shifts months before they hit the mainstream. We don’t suffer from internal politics or the “we’ve always done it this way” mentality. We only care about the numbers. In 2026, if you aren’t optimizing against the machine daily, you’re already behind.
The 5 Non-Negotiable Pillars of High-Performance Outsourcing
If you think PPC is still about manual keyword matching, you’re already obsolete. Modern outsourced paid search management requires a foundation built on performance, not platform-suggested best practices. We’ve identified five pillars that separate elite growth partners from the standard agency noise. These aren’t suggestions. They’re requirements for survival in 2026.
- Pillar 1: Data Science Integration. Stop looking at what happened. Start predicting what will. We move beyond basic conversion tracking into predictive modeling to identify high-value users before they even search.
- Pillar 2: Creative Strategy. In the age of automation, ad copy and video assets are your primary targeting levers. The algorithm follows the engagement, not just the bid.
- Pillar 3: Aggressive Bid Management. AI is a powerful tool but a terrible master. High-performance management balances AI automation with strict human-led constraints to prevent runaway spend.
- Pillar 4: Multi-Channel Synergy. Search doesn’t live in a vacuum. Connecting your search intent data with programmatic ads and social channels creates a feedback loop that lowers overall CAC.
- Pillar 5: Absolute Accountability. We ignore vanity metrics. There must be a direct, undisputed correlation between your ad spend and bottom-line revenue.
Data Science vs. Basic Analytics
Most agencies drown you in dashboards. They call it insights; we call it noise. High-performance marketing analytics must drive real-time campaign adjustments, not just justify last month’s invoice. In a cookieless 2026 environment, your first-party data is your only real leverage. You need a partner that can ingest CRM data to train platform algorithms on lead quality rather than just lead volume. Predictive ROAS is the new gold standard for 2026.
Creative as the New Targeting
The algorithm is smarter than your manual bid adjustments. It prioritizes high-engagement creative over perfect keyword matching. If your video ads and landing page assets aren’t under constant A/B testing, you’re leaving money on the table. Creative is now the primary lever for targeting. It filters the audience before they even click, ensuring your budget is spent on intent, not accidents. Aligning search intent with personalized content frameworks is how you win the 2026 attention war. If your current partner isn’t pushing for aggressive creative refreshes, you’re likely paying for underperforming industry norms.
The Agency Trap: Spotting Red Flags in Your PPC Partner
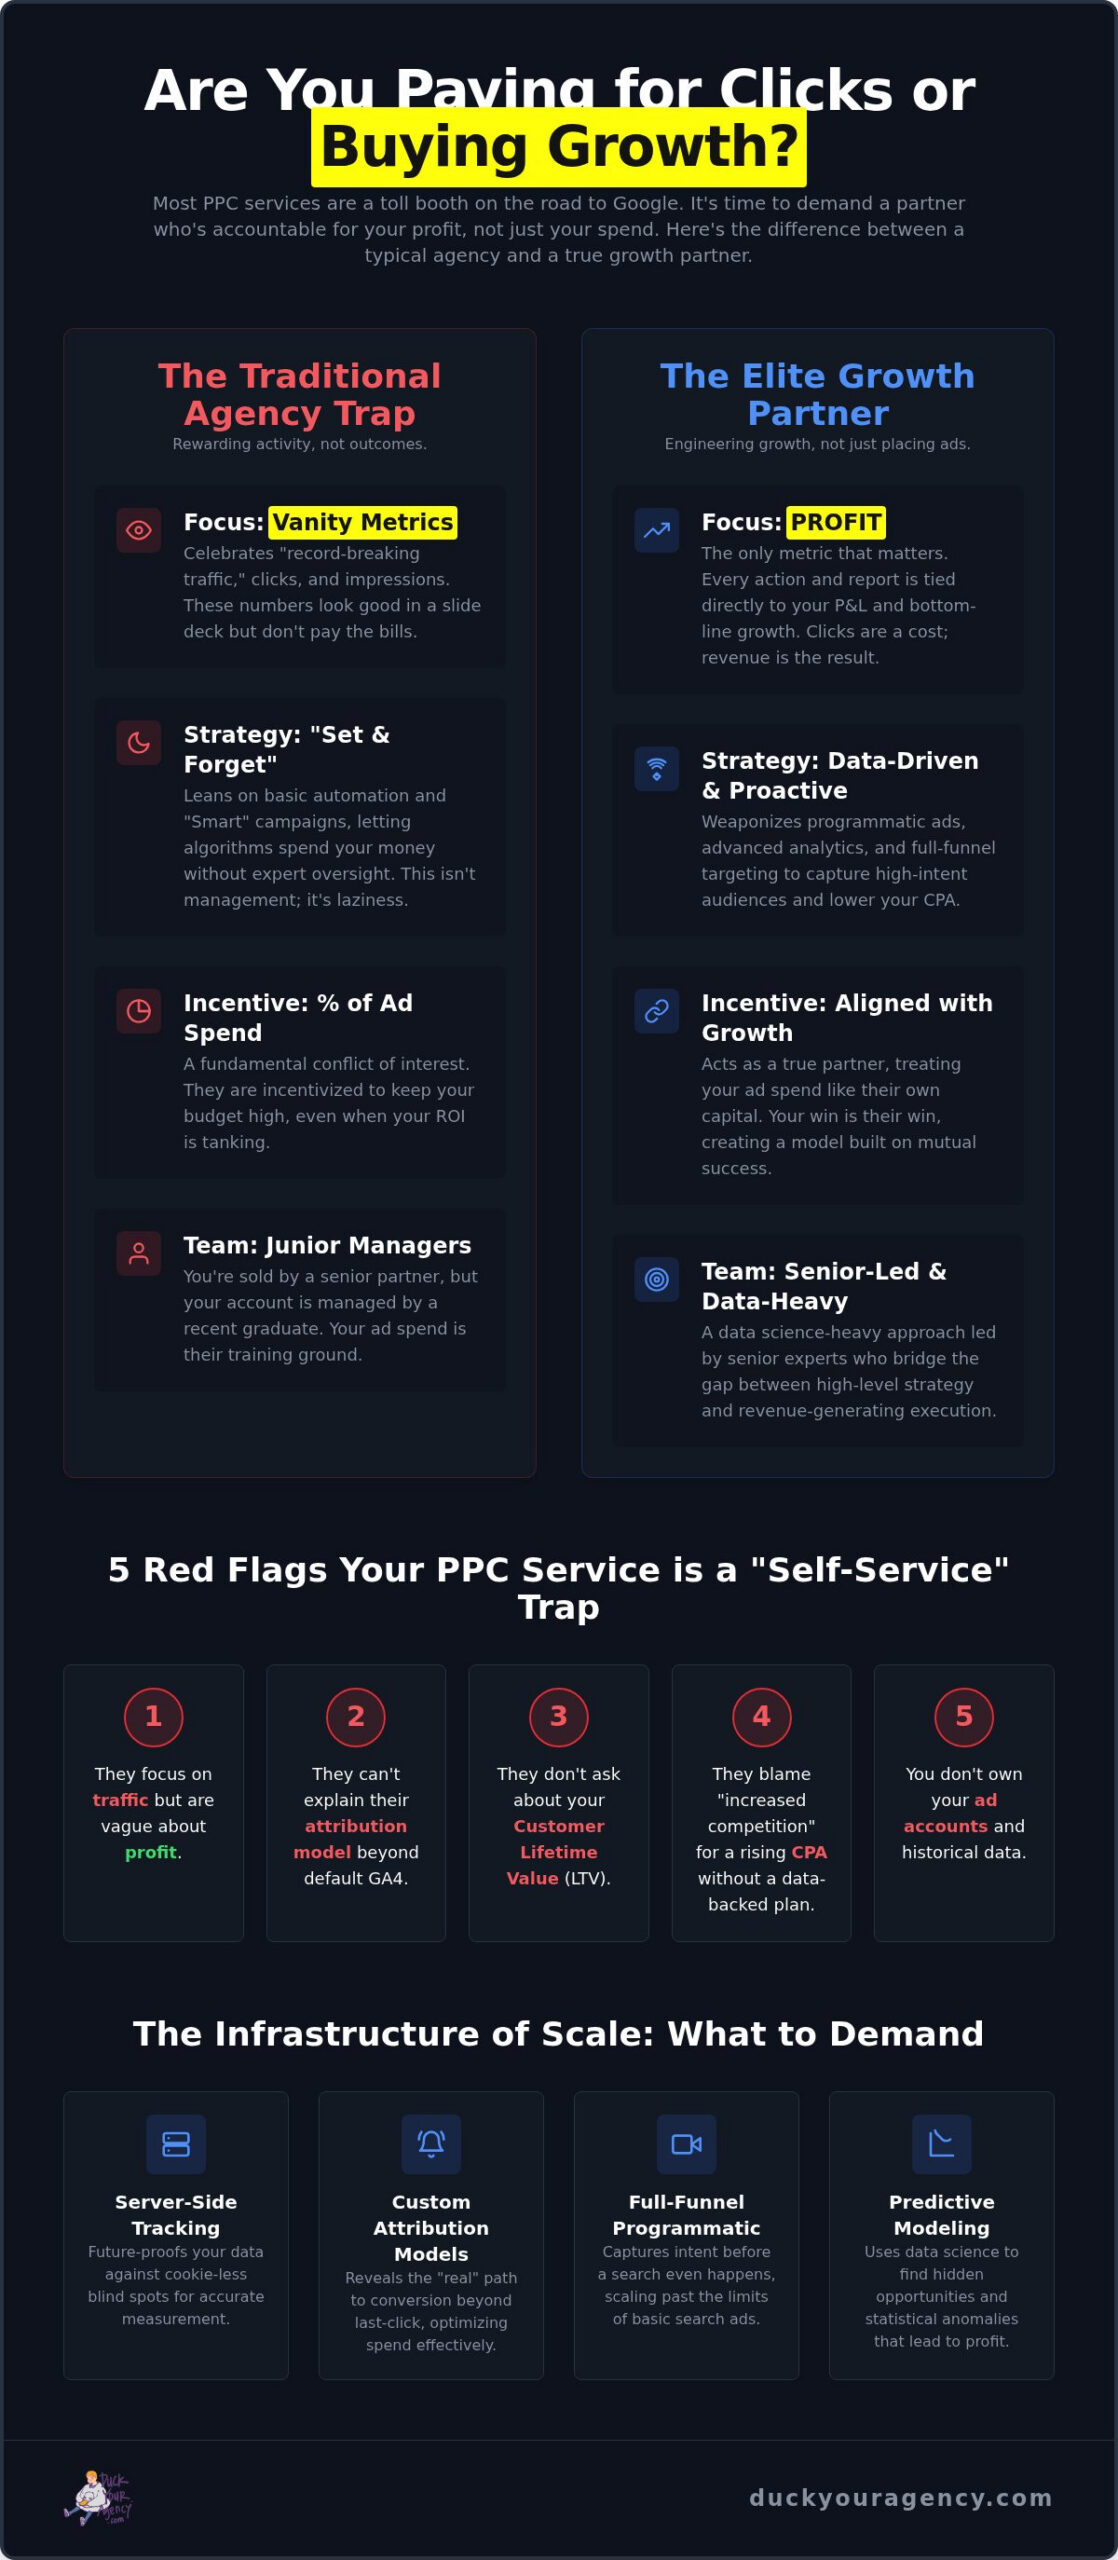
Most agencies are built on a conflict of interest. They profit when you spend, not when you earn. This is the fundamental flaw in outsourced paid search management today. If your partner’s primary incentive is to increase your monthly ad budget, they aren’t your growth ally; they’re a tax on your revenue. You need a partner that is obsessed with your bottom line, not their own management fee. Stop accepting “industry standard” excuses for mediocre results.
Transparency is non-negotiable. If you don’t have full admin access to your own ad accounts, you’re being held hostage. Some agencies hide behind “proprietary” setups to mask their lack of activity or to make it impossible for you to leave. If they won’t show you the raw data, they’re hiding something. Usually, it’s a lack of work. Clicks and impressions are just vanity metrics. They mean nothing if they don’t translate into tangible growth marketing results that show up in your bank account.
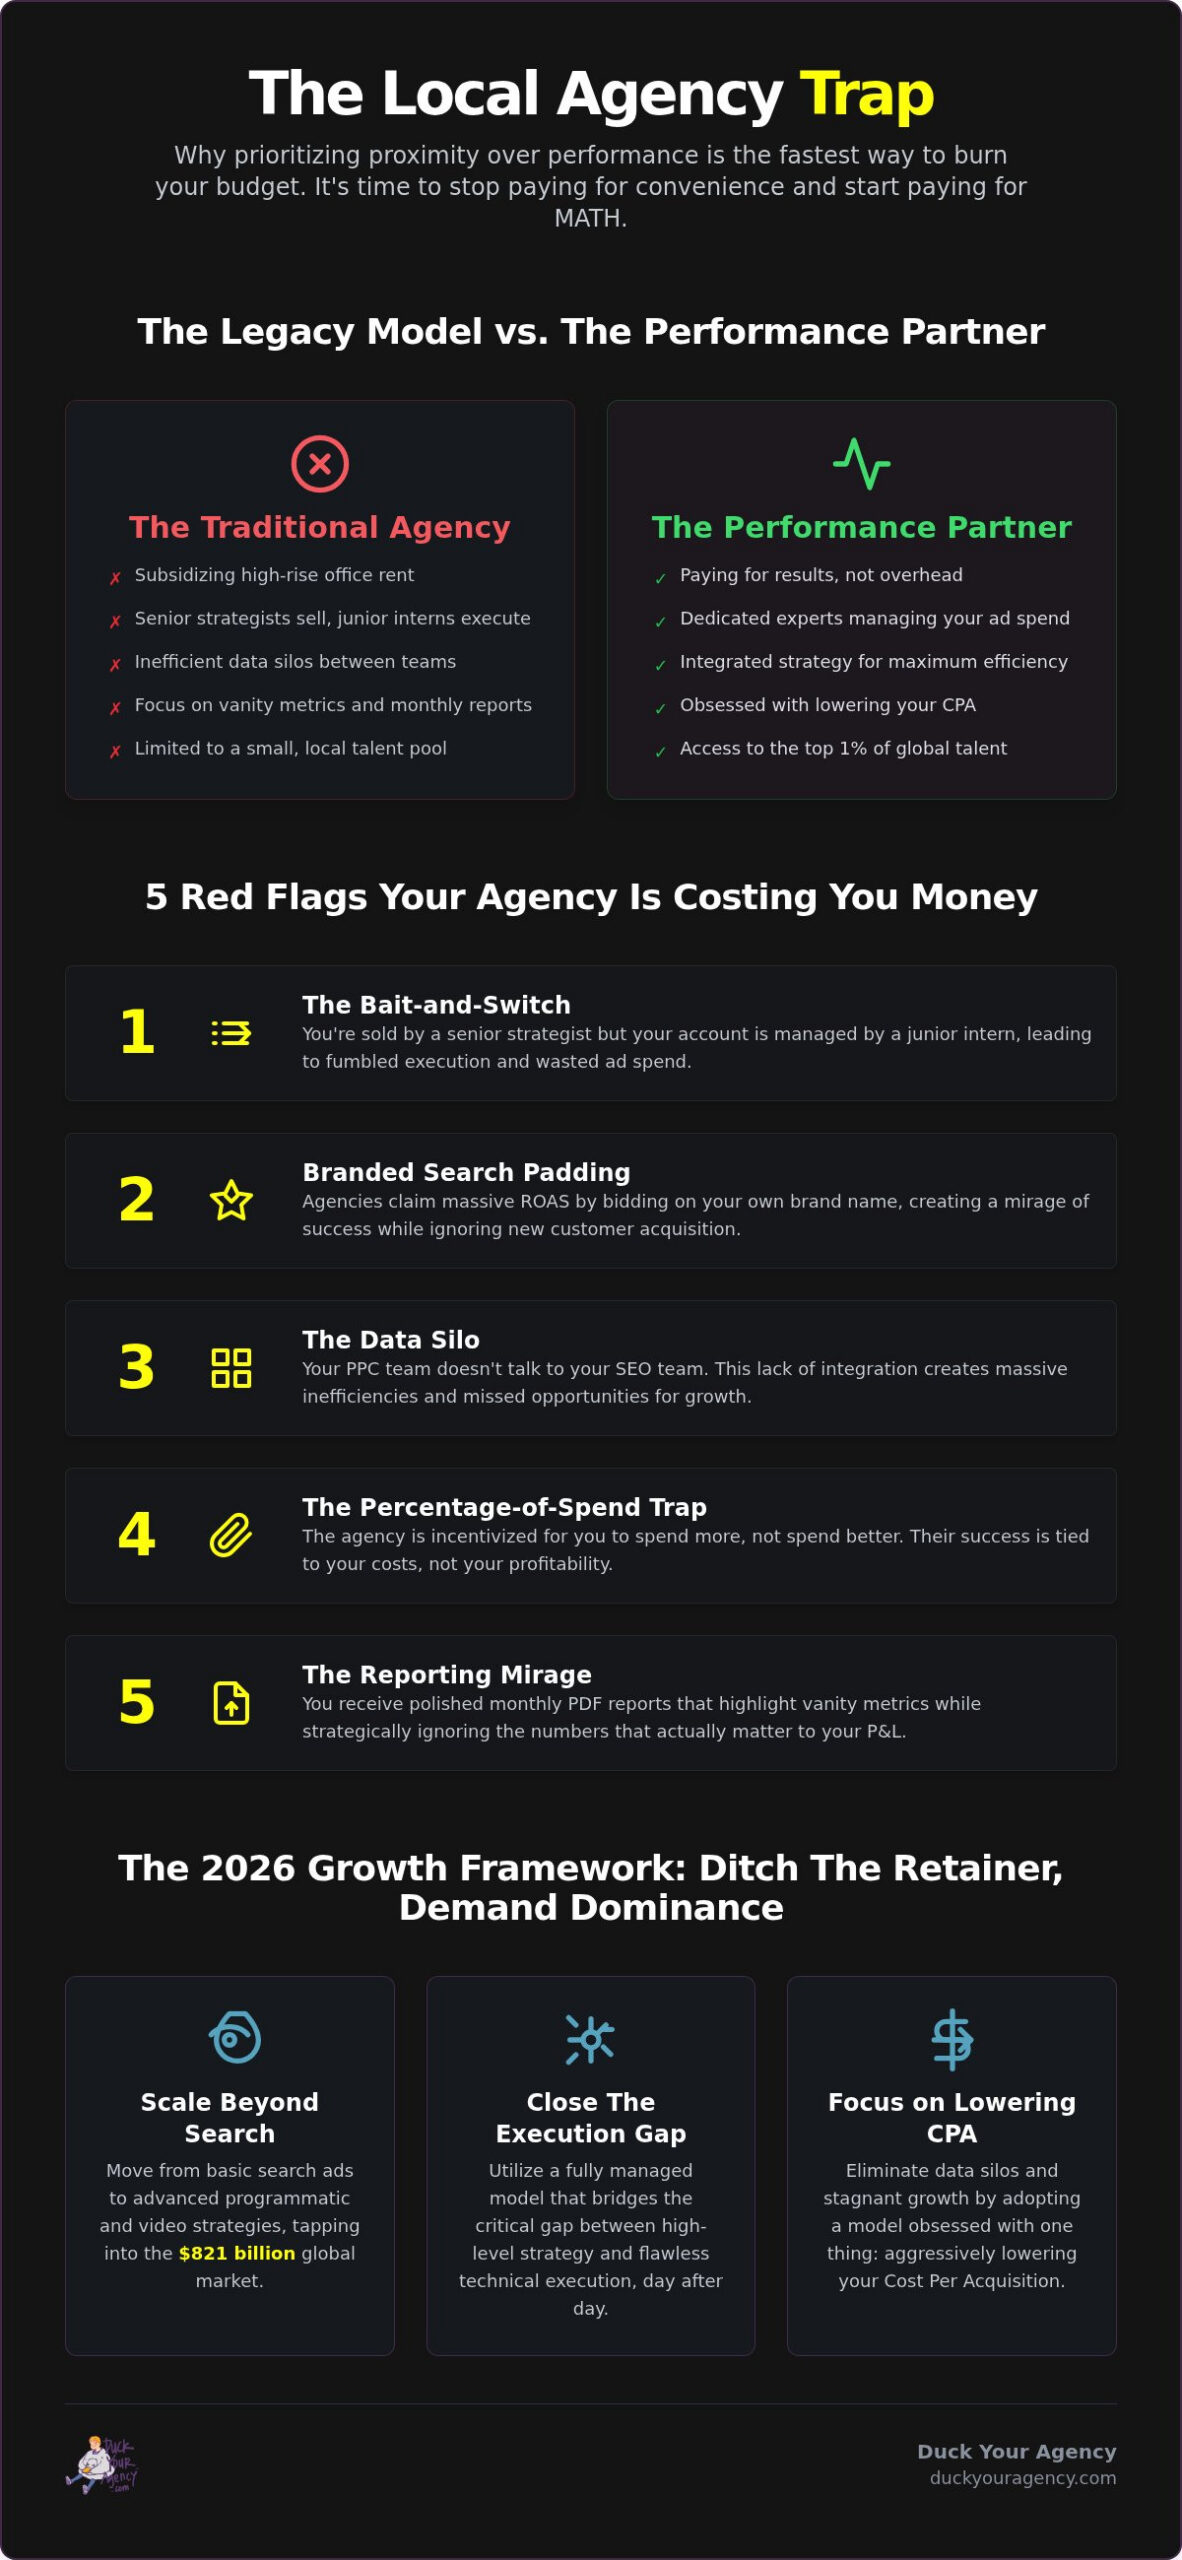
Watch out for the “Junior Manager” bait-and-switch. You met the senior strategists during the pitch, but now your account is being handled by a recent graduate with three months of experience. Your budget is too important to be a training ground for interns. Demand to know exactly who is pulling the levers in your account every single day.
Auditing Your Current Campaign Performance
Check your ROAS right now. Is it being carried by your own brand name? Many agencies inflate their performance by bidding heavily on your branded search terms. This creates “Artificial ROAS” by claiming credit for customers who were already looking for you. A legitimate fully managed google ads management service proves its value by winning new customers through non-brand, high-intent searches. Open your negative keyword list. If it hasn’t been updated in the last seven days, your agency has checked out. They’re letting the algorithm waste your money on irrelevant traffic while they collect their fee.
Contractual Red Flags to Avoid
Long-term lock-in contracts are a massive red flag. If an agency is confident in their ability to deliver, they don’t need to trap you for twelve months. Performance milestones should be the only thing keeping you in a partnership. Avoid any agency that insists on using their own “proprietary software” to report results. This is often a black box designed to obscure platform-level data. You deserve a “tough love” audit of your historical performance before you sign anything. If they aren’t willing to point out exactly where your previous agency failed, they’ll likely repeat those same mistakes.
The 90-Day Roadmap: What Actual Management Looks Like
Success isn’t a happy accident. It’s the result of a rigorous, 90-day execution framework that leaves no room for “maybe.” Most agencies spend their first quarter “onboarding,” which is usually code for doing nothing while they collect a check. Effective outsourced paid search management is a surgical strike on inefficiency. We don’t just tweak settings; we rebuild your growth engine from the ground up to dominate the 2026 landscape.
Month 1: Foundation and Forensics
We start with a deep-dive audit to find the “leaky buckets” your last agency ignored. If your tracking is broken, your AI is learning from garbage data. We cleanse your data streams and implement advanced AI paid search tools to build accurate audience models. This month is about forensic analysis. We align your search strategy with actual business growth goals, ensuring every dollar spent has a clear path to revenue. We stop the bleeding and set the stage for aggressive expansion.
Month 2-3: Aggressive Scaling
Once the foundation is solid, we shift from testing to dominating. We interpret early data signals to make bold budget shifts, moving capital away from underperformers and into high-intent auctions. This is where we set up the critical feedback loop between your paid search data and your internal sales numbers. We don’t care about platform “conversions” if they don’t turn into closed deals. This roadmap is the antidote to the standard “set and forget” approach that defines mediocre outsourced paid search management.
- Step 1: Deep-Dive Audit & Data Cleanse. Fixing the tracking errors that have been poisoning your algorithm for months.
- Step 2: Account Restructuring. Tearing down legacy SKAGs and moving to 2026-optimized frameworks that leverage broad intent.
- Step 3: Creative Launch & Testing. Establishing a baseline for high-impact video and copy assets that actually stop the scroll.
- Step 4: The Scale Phase. Identifying profitable pockets and aggressively increasing spend to capture market share.
- Step 5: Ongoing Optimization. The relentless pursuit of a lower CPA and higher LTV through constant iteration.
Stop settling for passive observation. Your budget deserves an aggressive ally that values speed and tangible outcomes above all else. Stop the budget incineration and dominate your market today.
Duck Your Agency: Outsourced Search for the Bold
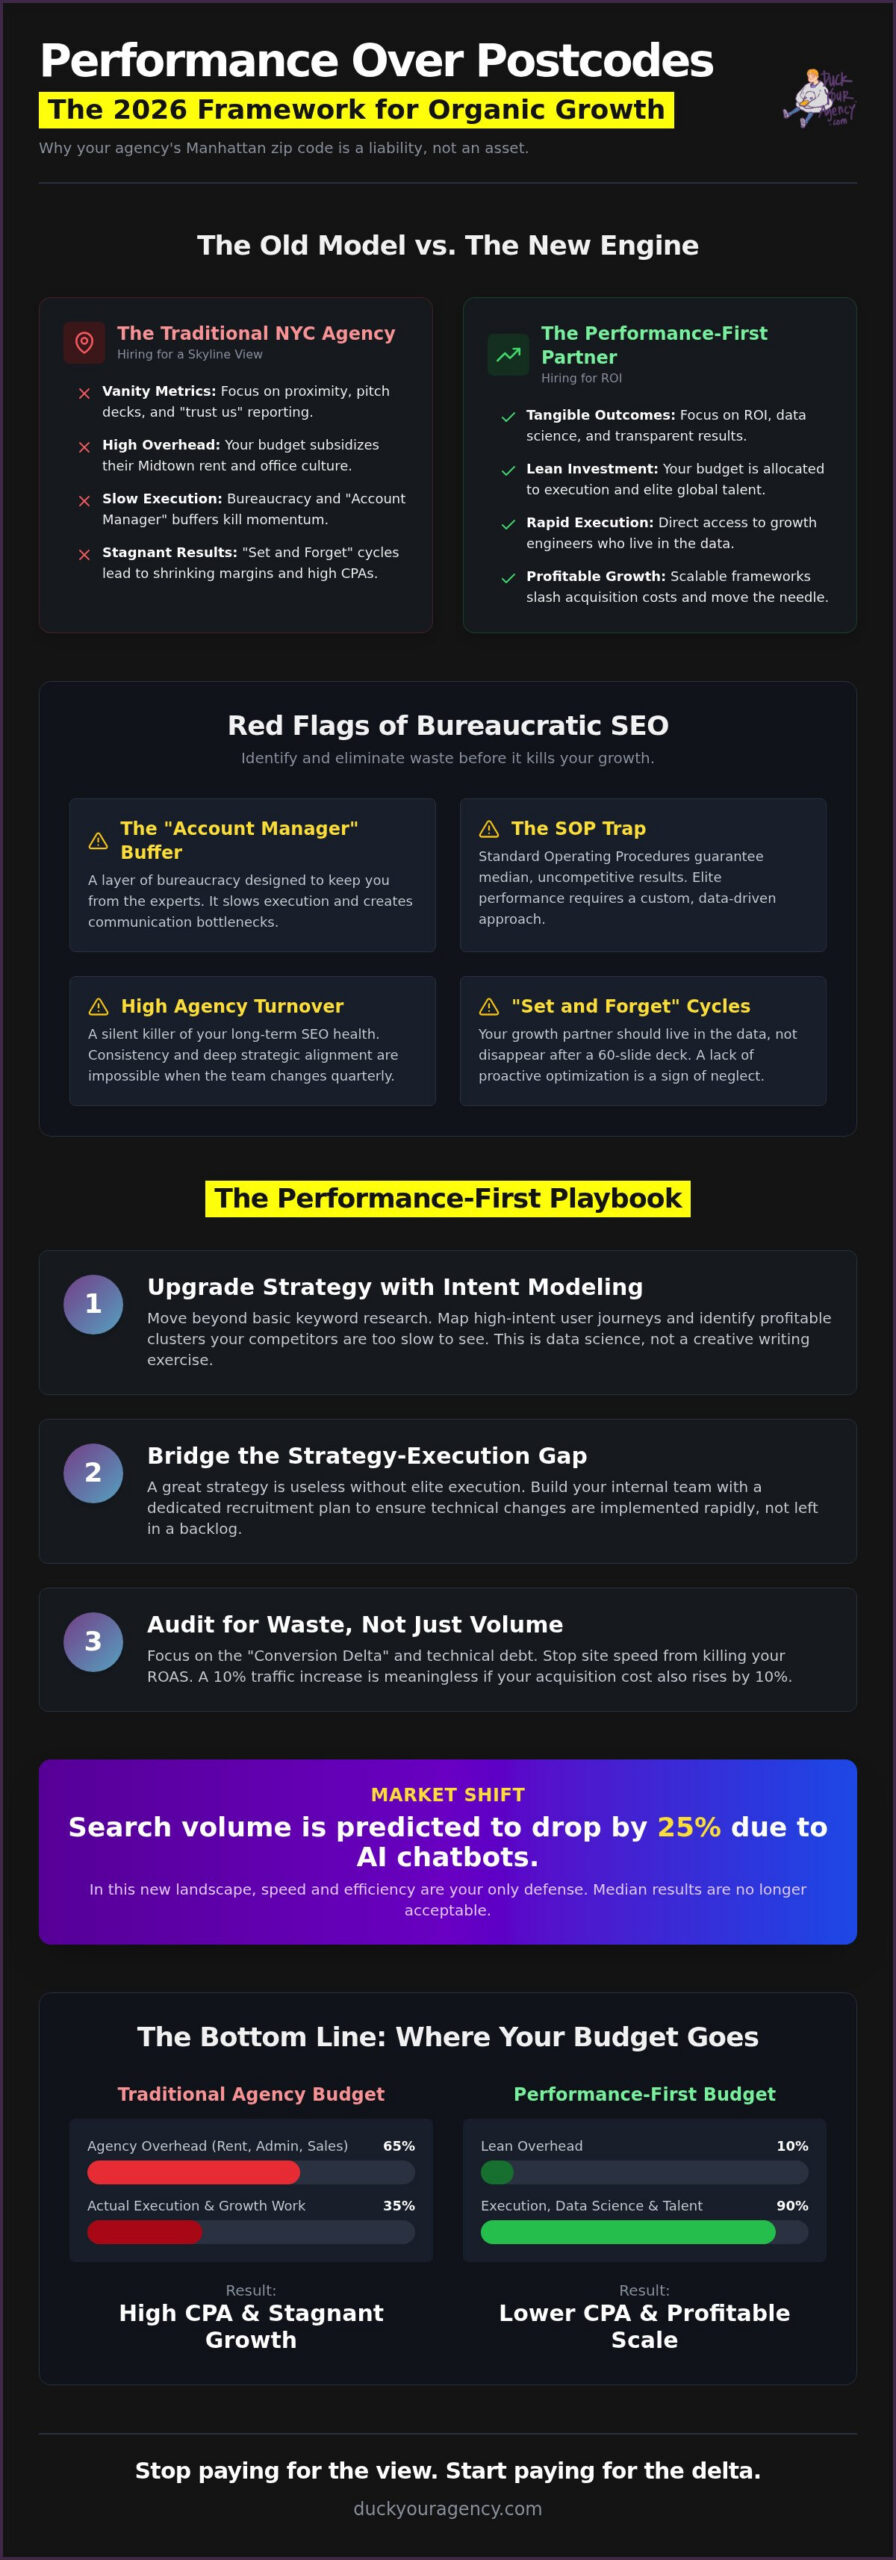
Standard agencies are built to survive. We are built to win. At Duck Your Agency, we reject the bloated, slow-moving model of traditional firms because it’s designed to protect the agency, not the client. Our approach to outsourced paid search management is an elite, high-performance partnership. We don’t just “manage” your accounts. We dominate your market by combining managed execution with elite data science. We have no patience for underperformance or traditional bureaucracy. We win when you scale, not just when you spend.
The Duck Advantage is rooted in accountability. While others hide behind “Black Box” platform excuses, we utilize data science-led optimization models to extract every cent of value from your budget. We bridge the gap between high-level strategy and the aggressive daily execution required in 2026. We are the specialized ally for brands that are tired of being treated like another number on a spreadsheet.
We offer something no traditional firm will: an exit strategy. Through our Digital Marketing Recruitment Services, we help you build an internal team when the time is right. Most agencies want to keep you dependent. We want to make you powerful. Whether we are providing Fully Managed Digital Marketing or helping you hire your first in-house specialist, our goal remains the same: predictable, aggressive growth.
Managed Advertising Built for 2026
Our specific approach to Paid Search Ads across Google and Bing involves more than just bidding. We integrate Programmatic Ads and Video Ads to create a multi-channel ecosystem that surrounds your target audience. We understand the “Rebel Expert” mindset because we live it. We don’t follow platform recommendations that prioritize Google’s revenue. We build custom frameworks that prioritize yours. This is strategy and execution working in total lockstep.
Your Next Move Toward Aggressive Growth
Waiting is a luxury you can’t afford. Every month you spend with a passive partner is another month of budget incineration and missed opportunities. The cost of delay is measured in thousands of dollars of wasted ad spend and lost market share. It’s time for a “no-nonsense” approach to your digital growth. We don’t do fluff. We don’t do filler. We do results.
The process is simple. We provide a performance audit that actually tells the truth about your current campaigns. No sugar-coating. No vanity metrics. Just a data-backed roadmap to scaling your revenue. Stop the bleeding. Stop the excuses. Start scaling your business with a partner that actually gives a duck about your ROI.
Stop Babysitting Algorithms and Start Scaling
The 2026 search landscape doesn’t forgive mediocrity. You’ve seen how the traditional agency model is designed to protect their fees while your budget burns on automated noise. True outsourced paid search management is a strategic weapon, not a line-item expense. It requires a partner that utilizes data-driven optimization models and elite 2026 platform expertise to navigate the “Black Box” of modern advertising. If your current provider is just clicking platform recommendations, they’re part of the problem.
Success in this environment demands high-accountability performance reporting and a relentless focus on bottom-line revenue. You now have the roadmap to identify red flags, audit your current performance, and restructure for aggressive growth. Don’t let another month of “Campaign Amnesia” or “Artificial ROAS” stall your progress. It’s time to bridge the gap between strategy and execution with a partner that actually gives a duck about your ROI.
Get Your Performance Audit and Stop Wasting Ad Spend
The market is moving fast. Take the lead and dominate your industry today.
Frequently Asked Questions
What is the typical cost for outsourced paid search management in 2026?
Pricing for outsourced paid search management varies based on your scale and the complexity of your data science needs. Most elite partners avoid the “percentage of spend” trap that rewards waste and budget incineration. Instead, you’ll typically see a combination of a flat management fee and performance incentives. This aligns your partner’s profit with your actual revenue growth. It’s significantly more cost-effective than the high annual salary required for a top-tier in-house expert.
How long does it take to see results after outsourcing my PPC?
Expect to see structural improvements within the first 30 days and significant scaling by day 90. The initial month focuses on forensic auditing and fixing the tracking errors your last agency ignored. Once the data foundation is clean, we move into aggressive testing and account restructuring. Real, sustainable growth requires enough data for the algorithm to learn. Dominating high-intent auctions isn’t an overnight flip; it’s a calculated 90-day strike on your competitors’ market share.
Should I outsource my paid search if I already have an in-house marketing manager?
Absolutely. Your in-house manager is often a generalist drowning in internal meetings and broad brand strategy. They lack the specialized “Black Box” tools and cross-account data insights that an elite partner provides. Outsourcing allows your internal team to focus on high-level strategy while we handle the technical execution. We act as a high-performance extension of your team, filling the talent gap that prevents multi-channel dominance in the 2026 landscape.
What is the difference between a traditional agency and a managed growth partner?
Traditional agencies are passive order-takers obsessed with vanity metrics like impressions and clicks. A managed growth partner is a proactive ally obsessed with your bottom line. We don’t just report on what happened; we use predictive modeling to dictate what happens next. While agencies hide behind platform-automated reports, we provide transparent, data-backed insights that correlate directly with your bank account balance. We win when you scale, not just when you spend.
Can an outsourced agency manage my Google Ads and Bing Ads simultaneously?
Yes, and they should. Managing Google Ads and Bing Ads in silos is a rookie mistake that ignores multi-channel synergy. A unified approach allows audience data from one platform to inform the bidding strategy on the other. We bridge the gap between platforms to ensure your brand dominates the entire search landscape. This cross-platform coordination lowers your overall CAC by identifying the most efficient path to conversion across the global search market.
How does Duck Your Agency handle Performance Max and automated bidding?
We don’t fear the machine; we feed it better data. Duck Your Agency uses data science-led optimization models to provide high-quality first-party signals to Performance Max and other automated bidding systems. Automation is a tool, not a strategy. We apply strict human-led constraints to prevent “automation drift” where the AI optimizes for cheap, low-quality clicks. We ensure the algorithm prioritizes revenue over the platform’s own earnings targets.
Will I still have ownership of my ad accounts if I outsource management?
You must maintain 100% ownership of your ad accounts and data. Any provider that refuses this is failing the “Transparency Test” and holding your business hostage. We believe in absolute accountability and total transparency. If we aren’t delivering results, you should have the freedom to walk away with your historical data intact. We earn your business every month through performance, not through restrictive contracts or proprietary data silos.
What metrics should I prioritize when evaluating an outsourced PPC partner?
Ignore the fluff. Prioritize metrics that impact your P&L: Predictive ROAS, Customer Acquisition Cost (CAC), and Lifetime Value (LTV). Clicks and impressions mean nothing if they don’t lead to predictable lead flow and revenue growth. You need to see a direct correlation between your ad spend and bottom-line revenue. If your partner can’t show you how their outsourced paid search management efforts are driving profit, they aren’t managing; they’re spectating.